
How to measure development performance in the era of AI (2026)
TL;DR
In 2026, judging how well a development team works is harder than it has ever been, because AI has cut the old link between output and skill. When a developer ships twice the code, you can no longer tell whether they got better, the task was trivial, or a model wrote something bloated that will cost you later. Raw output means almost nothing on its own now. This piece explains how we at Mercury built a way to measure both the speed and the quality of AI-assisted development, and to track it over time instead of guessing. The short version: take hard Git data (commits, merge requests, diffs) as ground truth, add an LLM that reads context and scores each change on four things (code quality, maintainability, performance, robustness), then cross-check the two against each other so neither can quietly lie to you.
The chart is green. So why are you uneasy?
Picture the last time you looked at your team’s velocity chart. Story points up. Merge requests flowing. The burndown behaving. By every number on the screen, things are fine.
Now picture the board call next week, when someone asks a simple question: how do you actually know the team is good? And you notice the honest answer is a feeling. A hunch. You think they are strong, but you could not prove it with anything on that dashboard.
That gap used to be survivable. AI made it dangerous.
Here is the result that should bother every CTO and engineering lead. In early 2025 the research group METR ran a controlled trial with sixteen experienced developers working on their own large codebases. Before starting, the developers expected AI to make them about 24% faster. Afterward, they felt roughly 20% faster. In reality, using AI increased their completion time by 19%. The same people had predicted a speedup and still believed they had gotten one. The engineers doing the work could not tell which direction they were moving. Even the study’s authors had gone in expecting a positive speedup.
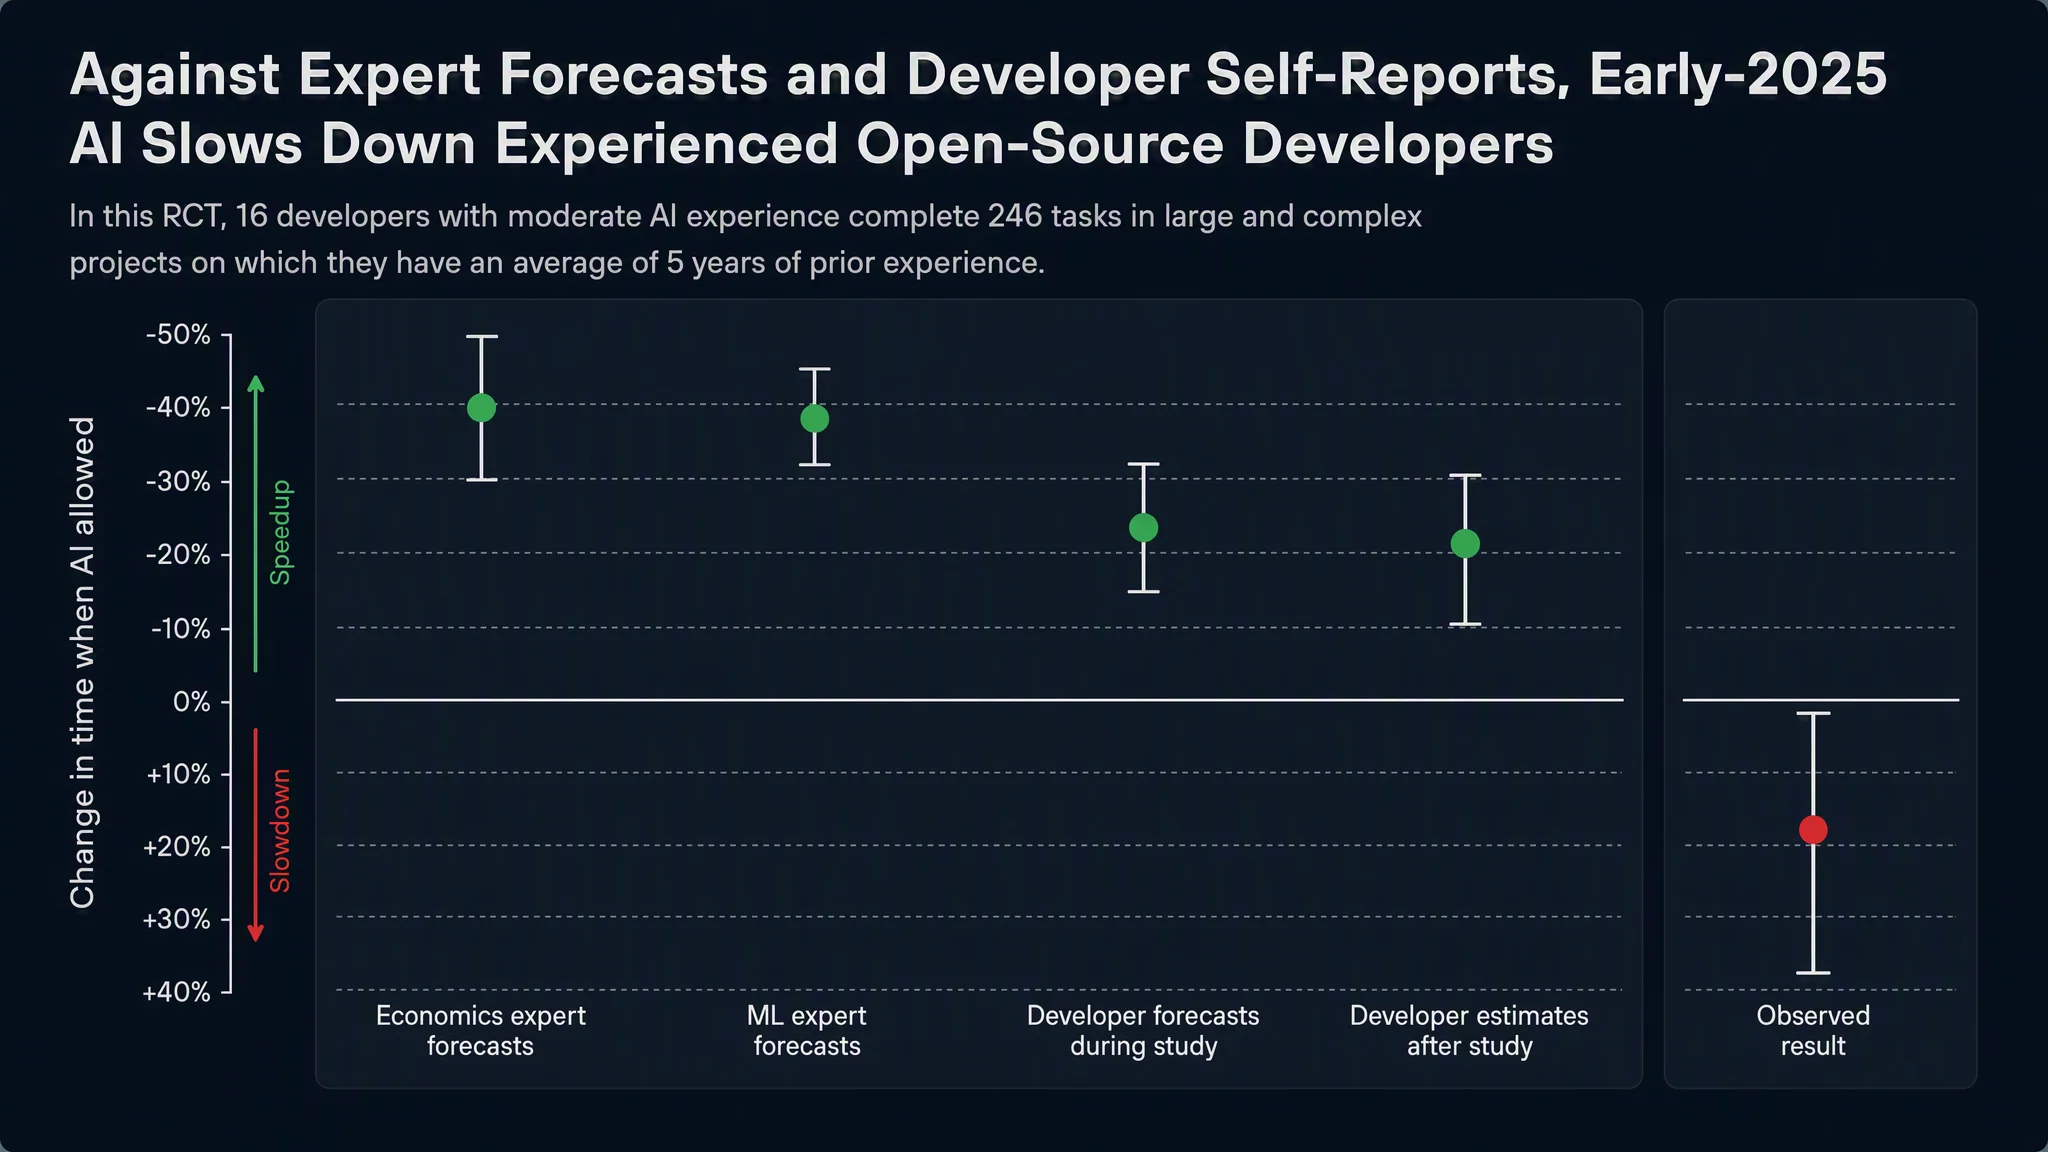
Source: metr.org/blog/2025-07-10-early-2025-ai-experienced-os-dev-study/
Here is where we want to be straight with you. That was early 2025, and the number has almost certainly moved since. METR’s own 2026 follow-up points the other way: experienced developers now look faster with AI, not slower. But METR could not pin a clean figure, because so many developers refused to work without AI that the sample skewed, and self-reported speedups are famously unreliable. Sit with that. The team whose whole job is measuring this lost the signal just as AI got good. At Mercury we use AI to ship faster, and for us it works. We can say it because we measure it, change by change, against the hard record of what shipped rather than the feeling in the room. That is what makes METR a warning rather than a verdict. The sign of the effect flipped. The part where you cannot read it by feel did not. Further down we show you our own numbers, measured that way, and then the system that produced them. The rest of this piece is about getting that visibility, and about pointing AI so the speedup is real instead of imagined.
Read that again, because it reframes the problem. It is not that good managers run on gut. Most of us lean on numbers: velocity, merge rate, lines shipped, and tickets closed. The trouble is that those are the exact numbers AI has quietly detached from skill and value. So even a disciplined, data-driven read is now measuring the wrong thing, which pushes the judgment back onto feel without anyone choosing to let it. If sixteen engineers could not feel the direction of their own output, a dashboard built on pre-AI assumptions will not catch it for you either.
Why the old way of judging a team got broken
The trouble is not that AI is bad, especially in good hands. It is that AI moved the costs to where your usual metrics do not look.
Speed shows up first. The bill shows up later. And almost every number a team watches by default (commits, lines shipped, tickets closed, velocity) is a first-week number. So a real speed gain and a real quality loss can sit on the same green dashboard for months, and nobody sees the second one until the codebase starts sending invoices.
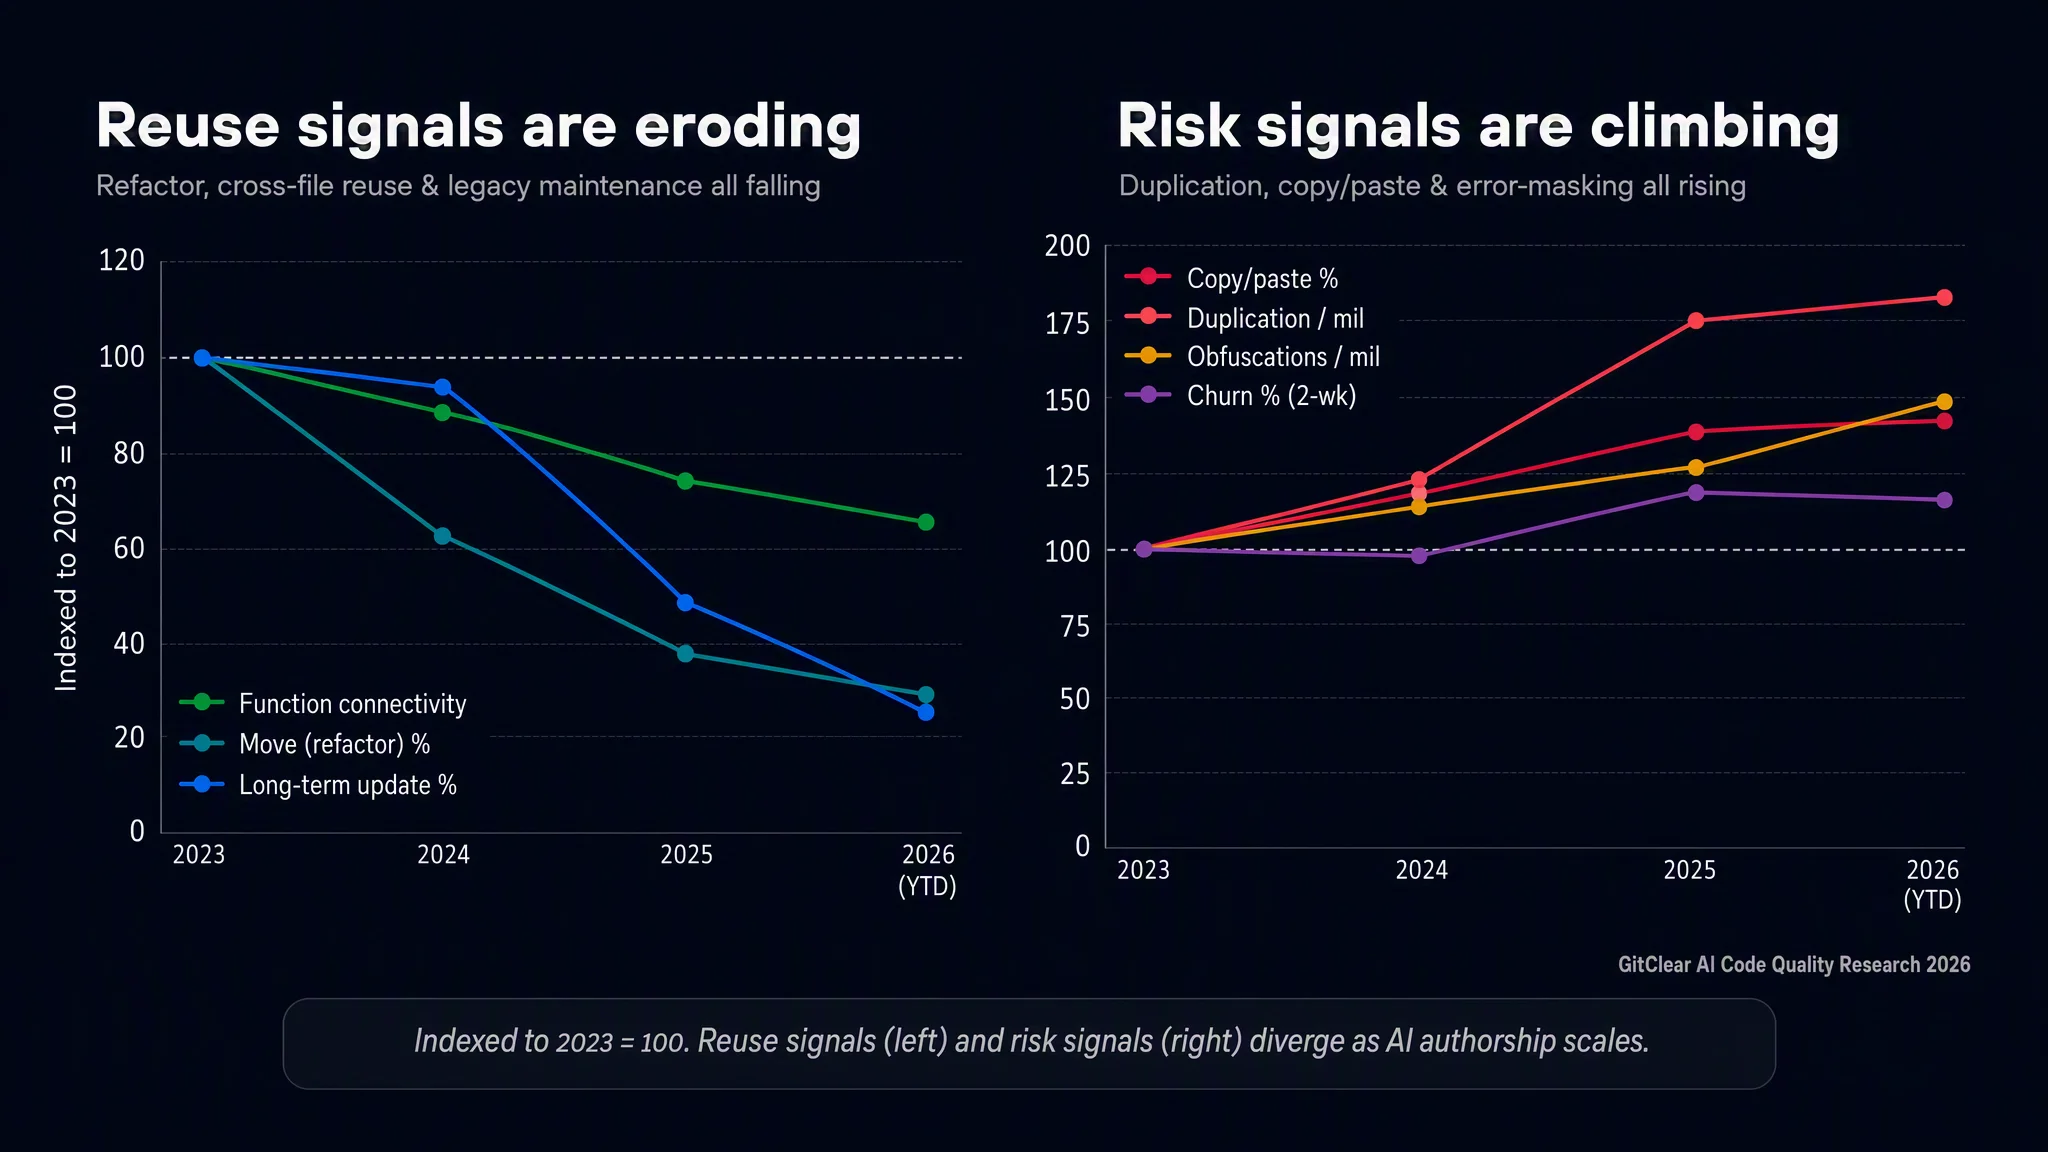
Source: gitclear.com/the_ai_code_quality_maintainability_gap
The codebase-level evidence keeps getting harder to wave away, and the newest cut is the most pointed. GitClear’s 2026 Maintainability Gap study tracked 623 million changed lines from 2023 through 2026. Over that window the habits that keep a codebase cheap to own eroded across every signal they measure. Refactoring line moves fell about 70%, cross-file reuse fell 35%, and returns to legacy code for cleanup fell 74%. At the same time copy/paste rose 41%, duplicated blocks rose 81% to the highest level on record, error-masking constructs rose 47%, and code rewritten within two weeks of being committed rose 15%. None of that shows up as a red number in a standard tracker. Duplication runs fine. It just multiplies the work of every later change and every review, and the bill lands in year three.
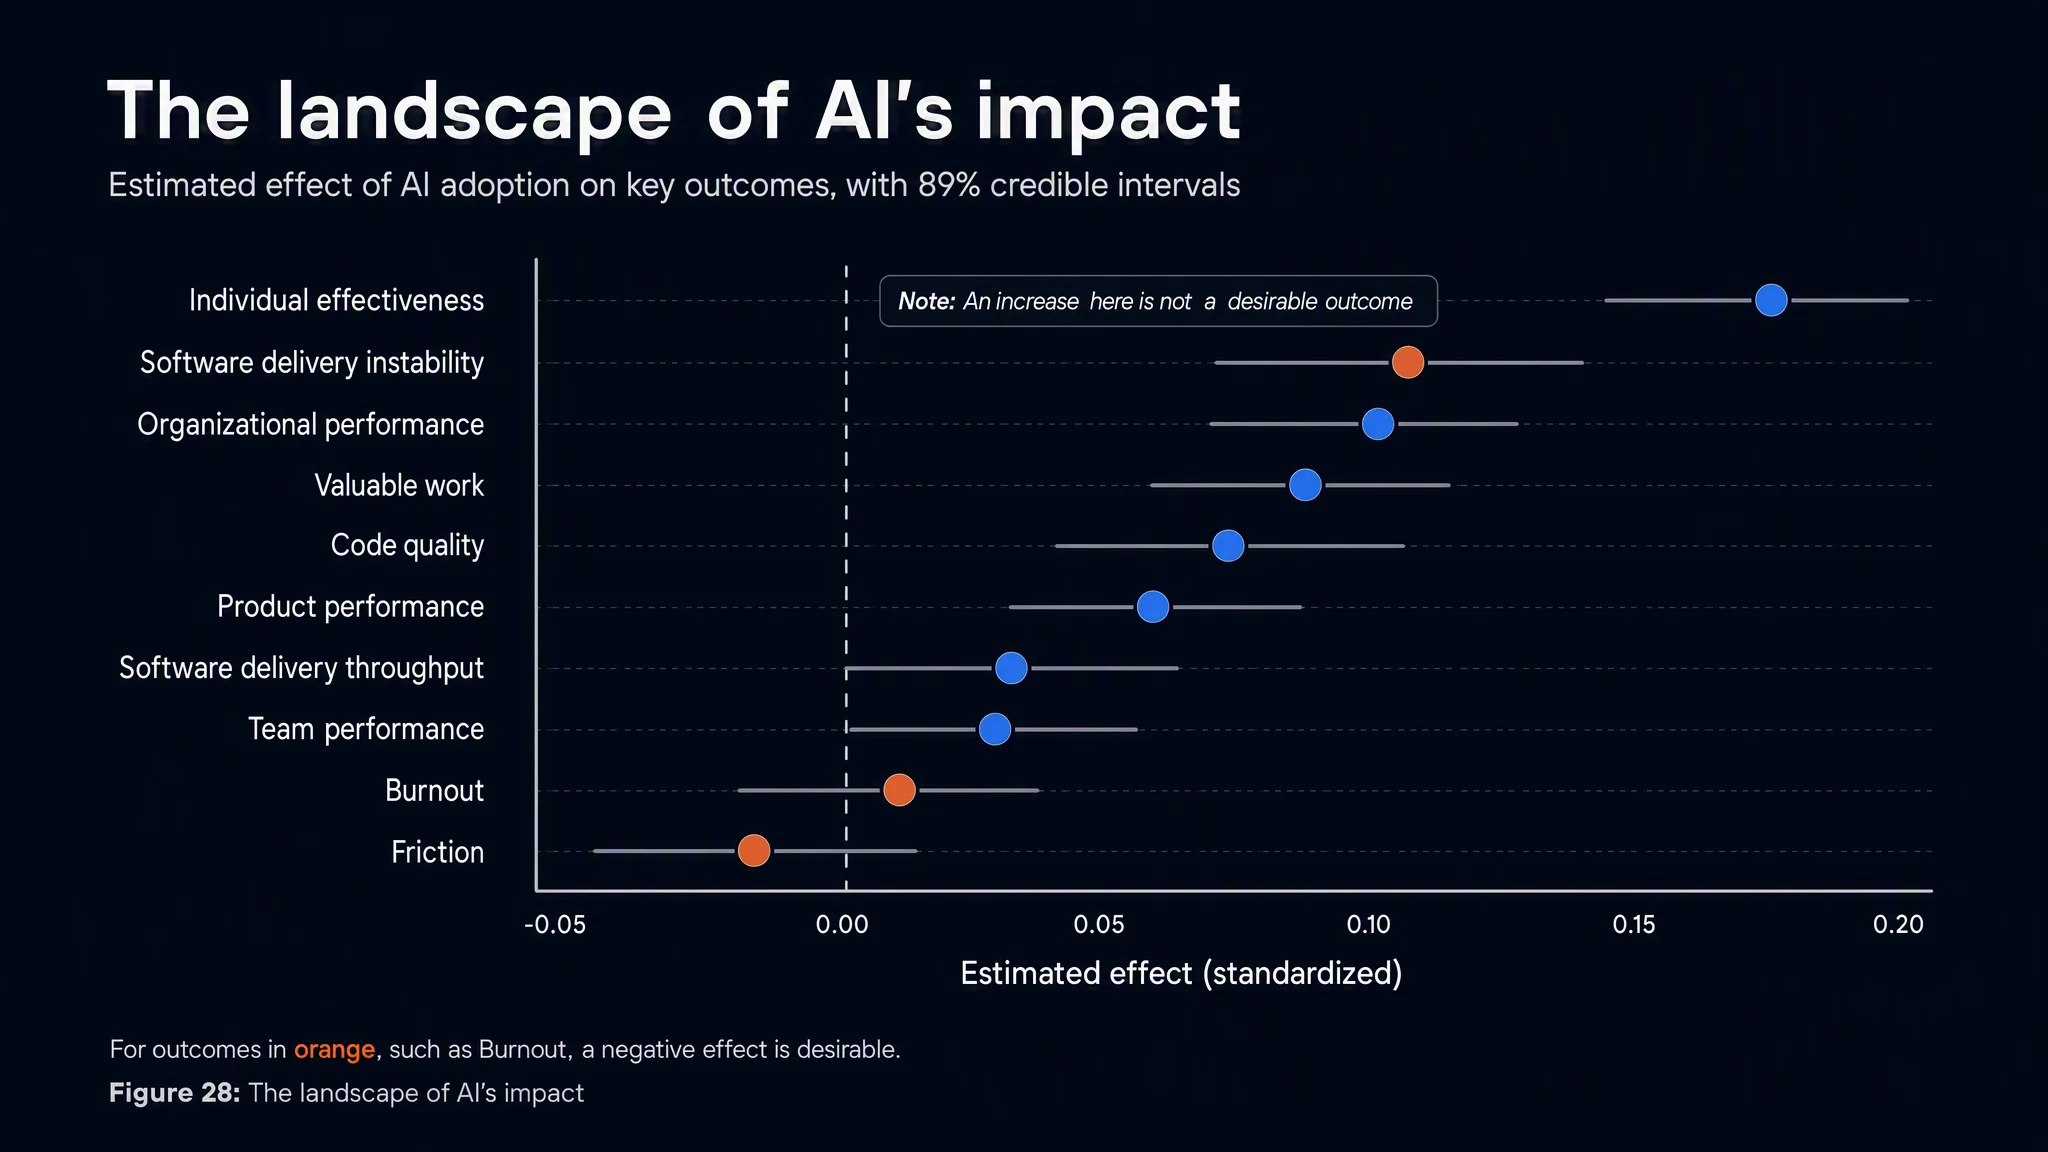
Source: dora.dev/research/2025/dora-report/
The macro picture agrees. Google’s 2025 DORA report surveyed close to 5,000 professionals, about 90% of whom use AI at work. Its finding is blunt: AI adoption is now positively linked to delivery throughput, but it still has a negative relationship with software delivery stability, because that acceleration exposes weaknesses downstream. DORA has a name for where the time actually goes: the hours saved writing code get re-spent auditing and verifying it, a hidden verification tax. The report’s own conclusion is the one worth pinning above your desk. Simple software delivery metrics, on their own, are no longer sufficient.
Pause on one line in that chart. Developers self-report that AI improved their code quality, while the objective codebase signals just above move the other way. Felt quality up, measured quality down. That is the same gap METR found on speed, and it is why we never let self-report stand on its own.
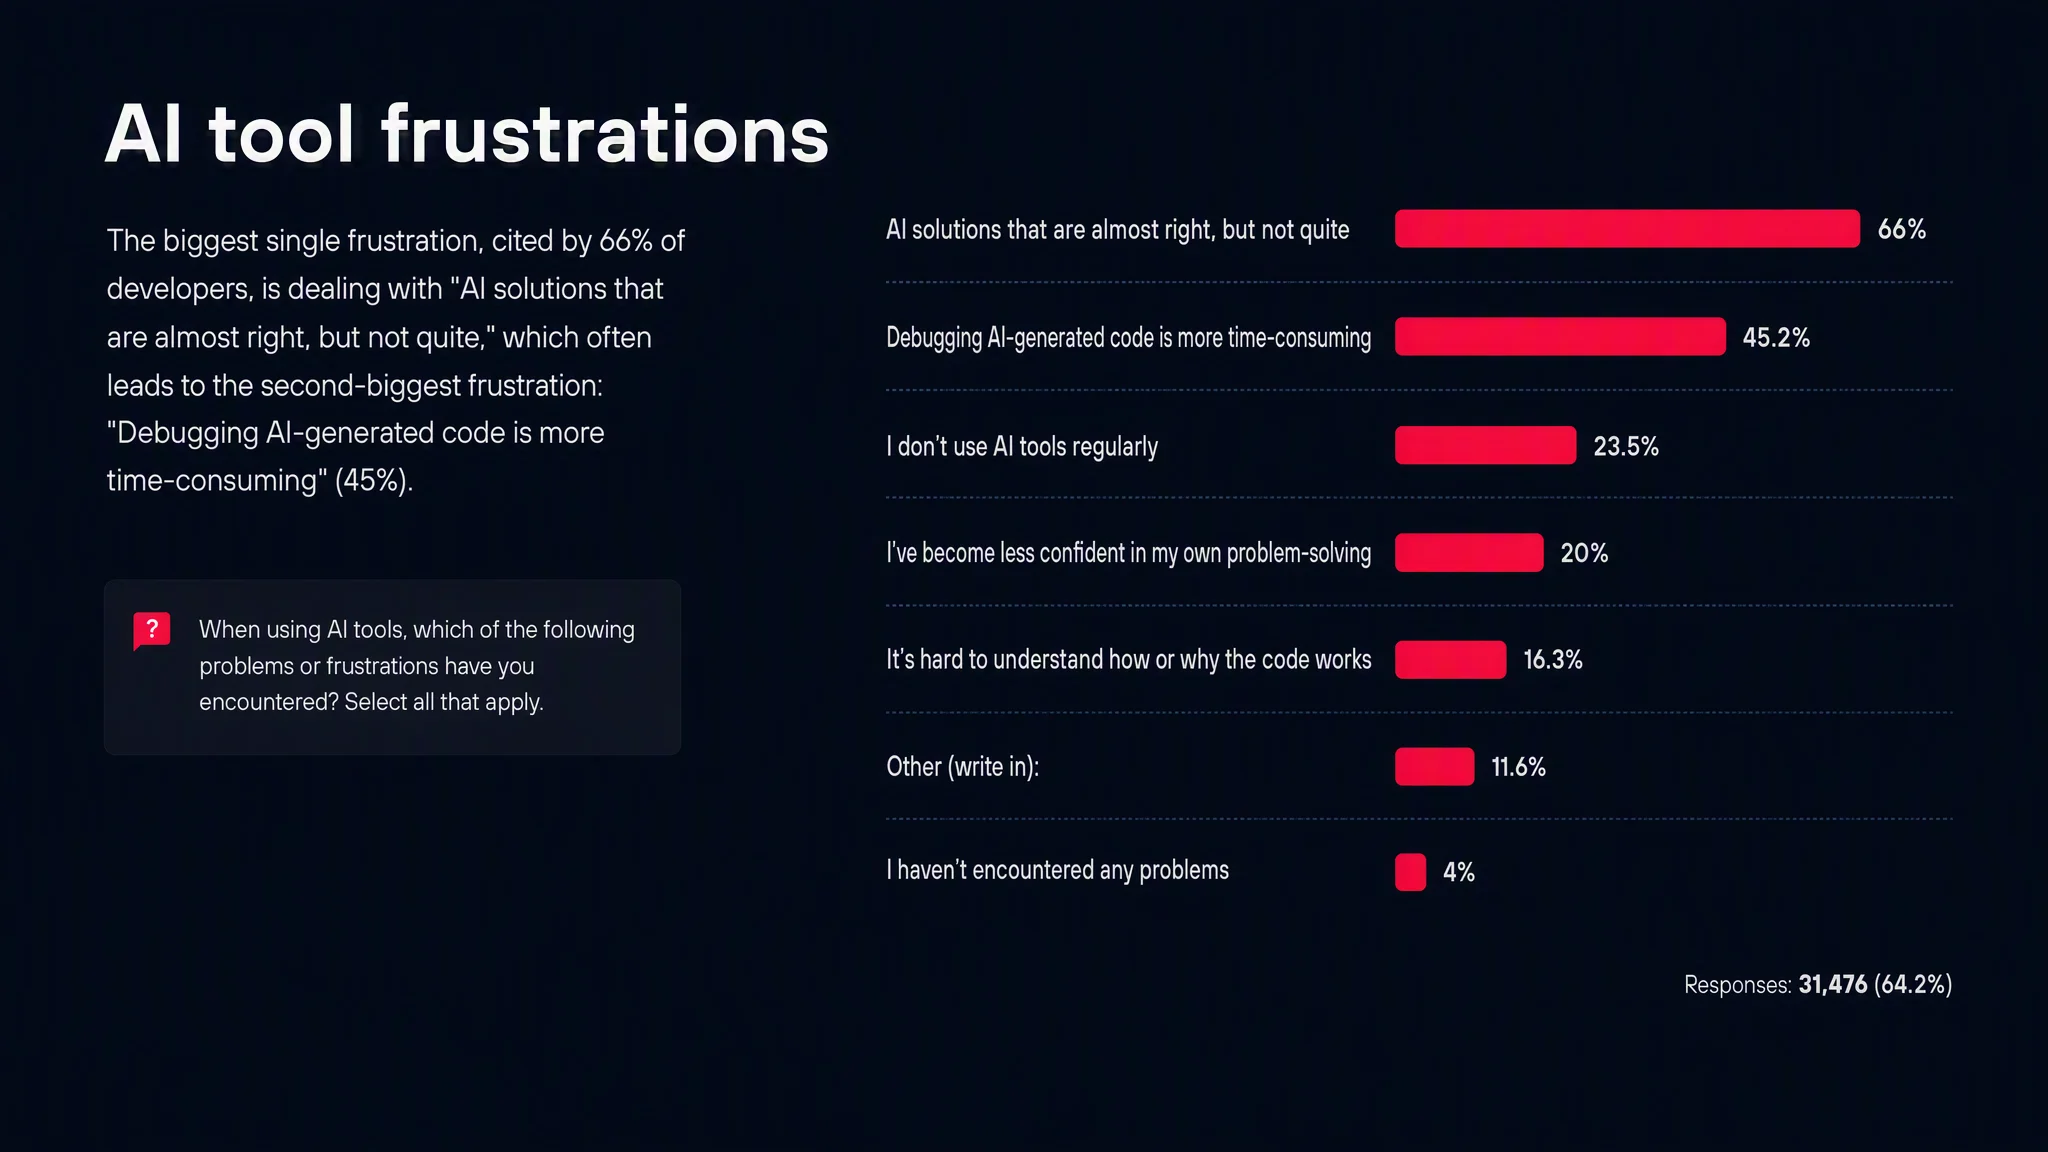
Source: https://survey.stackoverflow.co/2025/ai
The most common complaint about AI tools, from 66% of developers, is code that is almost right but not quite. That is the shape of the trust problem. In Stack Overflow’s 2025 developer survey, its latest and the largest in the industry, AI use rose from 76% to 84% while favorable sentiment fell from 72% to 60% and trust in the accuracy of AI output dropped from 43% to 33%. Only 3% say they highly trust the output. Teams are leaning harder on tools they believe in less, which is a strange place to steer from with no instruments.
Here is what that adds up to for the person accountable for delivery:
| What you usually watch | What it seems to say | What it hides |
|---|---|---|
| Lines and commits shipped | The team is productive | Whether a model wrote filler, or whether the work was trivial |
| Velocity trending up | Things are accelerating | Rework, duplication, and stability debt landing later |
| Features going out | Delivery is healthy | Review capacity falling behind the speed of change |
| “The team feels fast” | Morale and pace are good | METR’s gap: feeling faster and being faster are not the same |
DORA put it another way that matches what we see building software: AI does not replace code review, it makes review more critical. Faros’s 2026 telemetry across 22,000 developers shows the strain, with time spent in pull request review climbing sharply and more pull requests merging with no review at all. The pattern is throughput at the top and compounding quality costs at every stage below.
So the question stopped being “how much did we ship.” It became “how good was it, how hard was it, and is AI helping this specific person or just inflating their numbers.” Answering that by feel does not scale, and, as METR showed, feel tends to be wrong.
What we built
We set out to close that gap: to estimate both the quality and the speed of development in the AI era, and to watch it over time. The result is one tool with two modules that check each other.
The first module is a set of interactive dashboards. They pull the plain facts out of your repositories: merge request dynamics, lines added and removed, commit frequency and granularity, how quickly tasks close. This is the layer that captures the volume and pace of work.
The second module is an AI code analytics pipeline. An LLM pipeline does the part that used to require a senior engineer’s attention: reading context. It works out the type and complexity of the task behind a change (a small routine fix, a refactor, or new architecture built from scratch) and then scores the quality of the code against the specific scoring methodology.
Put together, the tool produces something we call a developer profile. Reading it, you can finally answer questions like: is AI helping this person write better code, or just more of it? Is quality holding up or slipping? Where is the team’s real bottleneck, and where does an extra investment make people grow faster?
Getting there meant solving two problems that trip up standard analytics before any scoring happens.
The first is the micro-commit. Plenty of developers save progress in tiny steps. A single commit might hold two lines, might not even run, might carry no finished logic. Treat those as full data points and your statistics bloat into noise. The second is the squash commit. When branches merge, a dozen small commits collapse into one, and the timeline of how the work actually happened disappears. The system groups work at the level of the merge request and logical blocks, and evaluates a task once it has taken its finished shape. That is how you see a developer’s real contribution instead of the churn in their change history.
The foundation: Git as ground truth
Any high-level analysis is meaningless without something solid underneath it. Ours is the direct digital trace in the repository, and it is deliberately straightforward and honest. A commit either exists or it does not. A branch was merged or it was rejected. Unlike opinions, questionnaires, or flexible frameworks, these facts are stable and reproducible.
But we do not just count. Counting commits tells you nothing useful if there is no additional context. Instead the Git layer looks for patterns, anomalies, and trends, and breaks the chaos of development into a few readable views.
It clusters activity into segments and benchmarks each engineer against an honest snapshot of their own cluster, not against some abstract company average. That alone makes evaluation fairer: you compare like with like. It runs statistical control on top, tracking the standard deviation of workload over time so that an unusual spike or a sharp drop lights up a marker instead of hiding in a monthly total. And it studies the shape of the distribution, which tells you whether someone works in a steady rhythm or whether new tools have made their cadence jagged.
You might reasonably ask: if you already have an AI that reads code, why build all this Git machinery at all?
Because the Git layer is the auditor. A language model is a semantic instrument. It judges logic and quality, and it can be confidently wrong. So its conclusions have to be confirmed on the ground by physical facts. If the model claims a developer is solving extremely hard problems while the Git data shows an anomalous standstill, the system flags the mismatch rather than trusting the prose. That makes the whole thing a double loop instead of a black box: every high-level judgment is backed by something you can count.
The hard part: scoring what the code actually is
This is the module that tackles the question everyone treats as unanswerable. Not how much code, but what kind, and how good.
To build it we spent months walking through how lead developers actually work: how they review, what they look at when they judge code during review, how they decide whether something is mature. After testing dozens of metrics and cutting everything that added noise, we settled on four pillars.
| Pillar | What it measures |
|---|---|
| Code quality | Adherence to architectural standards and readability |
| Maintainability | How easily other engineers can build on the code |
| Performance | Algorithmic efficiency and how fast the solution runs |
| Robustness | How well the code holds up against errors and edge cases |
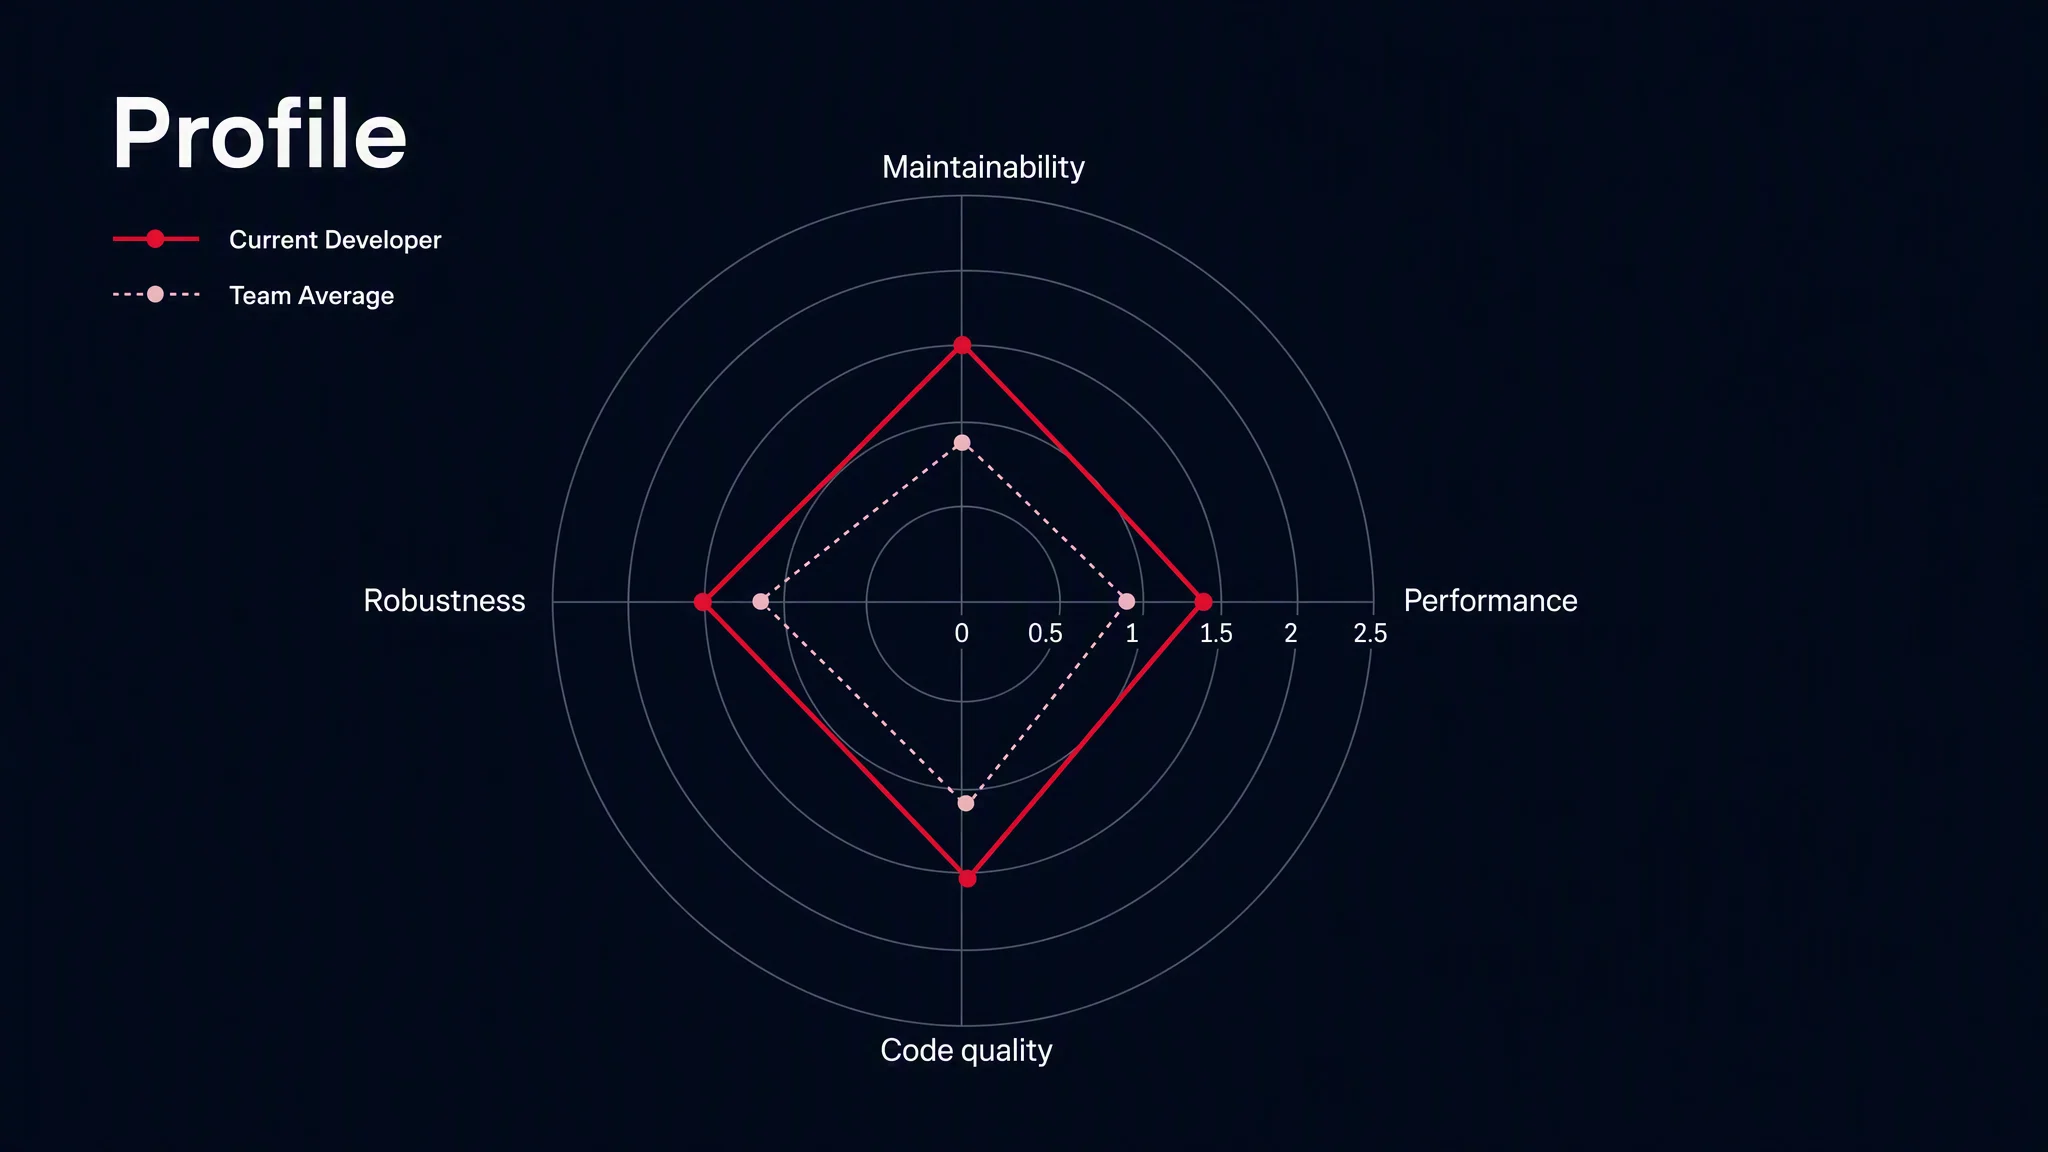
Source: Mercury internal developer-profile scoring (Git ground truth + LLM quality scoring). Single developer vs team average. Mercury’s own data, not independently audited.
Two problems make naive scoring worse than useless, and both come straight from real projects.
The first is legacy. Most products carry years of accumulated code, and developers often work under strict historical constraints. Score that in isolation and a plain LLM marks it down hard, never understanding why it was written that way. We handle this in the architecture: the tool computes a flexible base score, lets you read each pillar separately, and leaves the final call with a human. It offers an interpretation. It does not pass sentence.
The second is the trivial change. Any experienced reviewer knows you cannot judge an engineer from a variable rename or an updated enum. There is no room for architecture in it. But we watched LLMs do exactly the wrong thing more than once during testing: hand out high marks for a trivial config edit while judging a large, important feature more strictly. Left alone, that noise poisons the whole dataset.
So the pipeline stabilizes every score through a cross-normalization step:
[ source code diff + context ]
              |
              v
   [ LLM: semantic analysis ]
              |
              v
   cross-normalization:
     1. determine task type and complexity
     2. weigh the semantic significance of the change
     3. stabilize mathematically against Git data
              |
              v
   [ stable, objective profile ]
In practice: the model reads the change against its context (the merge request title and description that sum up the point of the task) and works out the task type, its complexity, and how significant the change really is. If a task is judged routine, the system isolates that result so it does not skew the developer’s overall profile. Then it locks the semantic read against the hard Git layer, so the physical volume and structure of the changes act as a filter on the model’s conclusions. The result is a calibrated read that tells routine apart from real refactoring on its own, and a clean profile for each developer that is protected from a model scoring on mood.
Why two layers instead of one
It comes down to this. The LLM gives you meaning. Git gives you proof. Either one alone will mislead you.
Lean only on the dashboards and you are back to counting output, which is the exact trap AI just sprang. Lean only on the model and you have traded gut feeling for a more articulate gut feeling, one that sometimes praises a config rename and frowns at a hard feature. Bolt the two together and each one keeps the other honest. That is the accuracy you can actually take into a board meeting.
What this is actually for
Strip away the machinery and this was never about a scoreboard. It is about fairness and growth.
For years, judging a developer came down to a hunch and a performance review shaped by whoever spoke up loudest. Now the mid-level developer drowning in architectural work gets noticed before they burn out. The quiet engineer doing genuinely hard things gets credit that used to go unseen. And every conversation about someone’s growth starts from facts instead of impressions. For a company, that is the difference between guessing at your talent and understanding it.
Multiply that across every team and it changes the organization: people placed where they are strong, engineers growing faster, and a clear read on which tools are worth the money. In the AI era, the companies that win will not be the ones that adopted the technology first. They will be the ones that understood their own people and their pipelines well enough to point that technology where it mattered.
What the acceleration actually looked like for us
Our own numbers at Mercury moved as the tools matured, and we watched them the way this article describes: hard Git data underneath, an LLM quality score on top, tracked through to production rather than guessed at.
Early on, the gains belonged mostly to the enthusiasts, the people willing to rebuild their workflow around AI. Across their work we measured an average improvement of roughly 10-20%, even though a single task could already land several times faster. Those dramatic cases were real. They were not yet the normal pace of a project.
By early 2026, after we built an internal AI-assisted development system around the whole workflow, Mercury crossed a different line: more than a twofold improvement on average across the full life of a project, all the way to production release. That distinction is the one that matters. A task finished twice as fast is a nice moment. A project delivered twice as fast, without quietly pushing the saved time into review, rework, or stabilization, is an operating advantage. And it held without a drop in the code quality we score on every change.
The gains also stopped belonging to a handful of unusually motivated engineers. As we rolled the system into projects and tuned it to each team’s codebase and constraints, the acceleration reached most of our teams, not just the early believers.
By the summer of 2026, some individual tasks were running more than twenty times faster, while the average across the work we measured sat around threefold. The headline number is the tempting part. The progression is the honest part. We started with isolated wins. Then the acceleration began surviving all the way to release. Then the system reproduced it from one team to the next. That is the line between experimenting with AI and building a capability out of it.
See what this looks like on your own codebase
If any of the above sounds like your last quarter, you do not have to take our word for it. We will run a limited analysis on a recent stretch of your repository and hand you a one-page snapshot: how the work actually moved, how hard the tasks were, and how the code holds up on quality.
It is a document you keep. It is not a pitch, and there is no obligation to work with us after you read it. Think of it as a second pair of eyes on your codebase, from people who look at this for a living, and a way to trade the hunch for something you could put in front of your board.
The dashboard will always look green. The point is to know whether it is telling the truth.